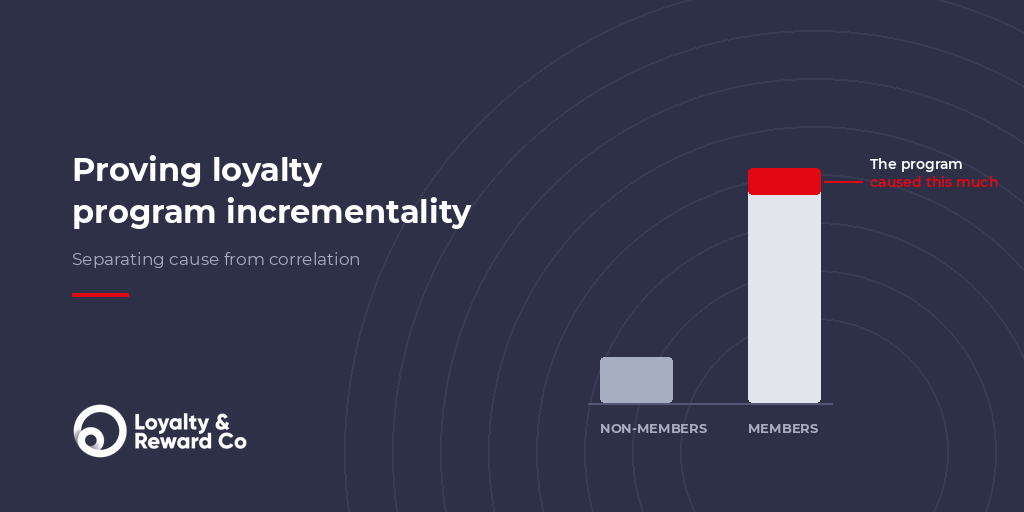
Loyalty program members spend more than non-members. That gap is the most quoted figure in loyalty measurement, and it is the least reliable. This is because the customers who join a loyalty program first are usually the customers who were already spending the most. A comparison between members and non-members captures that difference along with any effect the program itself created, and it rarely separates the two.
Separating them is the work of measuring loyalty program incrementality, meaning the share of member behaviour a program directly drove as opposed to behaviour that correlates with membership. It is the distinction a finance team will press hardest on, and the one most loyalty business cases handle least well.
This article sets out how to separate cause from correlation in loyalty measurement, which methods are available, and what to do when a clean test is out of reach.
Why do members outspend non-members even when the program does nothing?
Leenheer, van Heerde, Bijmolt, and Smidts (2007) studied seven grocery loyalty programs in the Netherlands. Their question was how much of a household’s total grocery spend goes to the retailer whose program that household has joined.
Members gave that retailer 36 per cent of their grocery spend. Non-members gave 7 per cent. That is a 29 percentage point gap, and the kind of figure that ends up in a loyalty business case.
The gap does not show what the program achieved. Members chose to join, and the households most likely to join a grocery program are the ones already doing most of their shopping at that retailer. Their spending was concentrated before the program reached them and would likely continue if the program closed down tomorrow.
The researchers separated the two effects using a statistical technique that models the decision to join alongside its consequences. Of the 29 point gap, membership accounted for 4.1 percentage points. The rest was already there before the program arrived.
Self-selection bias is the term for this. Customers who expect to benefit most from a program are the most likely to enrol, and those are the customers who were already loyal. Any ROI figure resting on a member versus non-member comparison is better treated as an upper bound than an estimate.
What are four ways to measure loyalty incrementality?
Four methods are available to most programs. They differ in what they control for and where they break down.
| Method | What it controls for | Where it fails |
| Randomised holdout | Everything. The groups are split at random, so the only difference between them is the campaign | Only answers the question you tested. |
| Geographic or channel staggering | Differences between members, plus anything already different between the market with the program and the market without it, since the comparison is how behaviour changed in each | Breaks down if the two markets diverge for reasons unrelated to the program, such as a competitor opening in one of them |
| Pre and post enrolment comparison | Differences between people, since the comparison is the same customers over time | Customers often join at a moment of elevated need or spend, so the earlier period understates their true baseline |
| Matched non-member cohort | Observable differences such as spend, frequency, and location | Cannot match on the unobservable reason a customer joined, which is the thing driving the gap |
A randomised holdout gives a finance team the most confidence, and a matched cohort the least. Most programs use them in the reverse order. A staggered rollout sits in between and is the most commonly wasted opportunity, since any program with a phased launch already has a natural test available and most never run it.
How do you run a loyalty program holdout test?
Withholding a whole program from a market is rarely acceptable to a business. Holding a small random group out of a single campaign is routine, and it produces the same kind of evidence.
A workable design excludes a small random share of the intended audience, often around 5 per cent, before a campaign is sent. That group either receives nothing or receives a placebo message. Incrementality is then the difference between the two groups, expressed as a share of the exposed group’s result.
Four design decisions determine whether the answer is usable.
- Keep the exclusion random. A control group chosen by any business rule reintroduces the selection problem the test exists to remove
- Test one thing at a time. A campaign carrying a bonus offer, a tier promotion, and a category message produces a result nobody can attribute
- Run it long enough to cover a full purchase cycle. In grocery or quick service that may be a few weeks. In categories where customers buy once or twice a year, a meaningful window can be 12 months or more, and anything shorter tends to report normal variation as a result
- Handle the excluded group carefully. Members who discover they were left out of an offer create a service and trust issue, which is a further argument for holding tests at campaign level
The same structure tests acquisition, spend, or retention depending on how the campaign is built. An acquisition test might offer bonus points to anyone who joins and spends within 30 days, targeting only people who have not purchased in the previous 12 months so that existing customers are excluded by design.
What if a clean test is not possible?
Plenty of programs have good reasons for not running a controlled test. Retention takes longer to show up than any sensible test window. The platform will not segment an audience reliably. Or the business will not hold value back from members while a sales target is at risk.
The data a program already holds usually contains a better comparison than members against non-members.
Join dates are the most useful of them. Members who joined in March and members who joined in September were both non-members at some point, so the September group serves as a control for the March group in the months before they enrol. Everybody joins eventually, so nobody is denied anything, and the comparison costs nothing to run.
Redemption timing gives another. Members who redeem behave differently from members who accumulate and never redeem, and the moment of redemption is recorded. Comparing spend in the weeks either side of a first redemption isolates a specific program mechanic which is a narrower claim and an easier one to defend.
Lapsed members are the closest thing to a matched comparison group most programs have. They were once motivated enough to enrol, which no non-member ever was, so the gap between active and lapsed members says something about engagement rather than about who chose to sign up.
Finance teams rarely reject a loyalty number for being imprecise. They reject the ones that turn up without a method attached, because nobody can explain them next quarter when they move.
Why are loyalty benefits harder to see than loyalty costs?
Loyalty program costs are visible and immediate. Reward costs, platform fees, and campaign spend all appear as outflows in a marketing budget. The benefits are spread across the business and arrive over time, which makes them harder to attribute and easier for a finance team to discount.
Loyalty & Reward Co sort program benefits into three tiers by how confidently each can be evidenced.
| Tier | What it covers | How it is evidenced |
| Known | Campaign specific acquisitions, incremental spend from campaigns, members retained through campaigns, cost per acquisition savings, margin uplift | Directly measured against a control group at campaign level |
| Observed | Incremental acquisitions, incremental spend, improved retention, redemption uplift | Cohort comparison across the member base, with the limitations of each method acknowledged |
| Estimated | Unrealised value from unredeemed points and lifetime value, membership fees, subscription fees, margin on point sales, partnership revenue, cost savings | Modelled, with documented assumptions and sensitivity analysis |
Sorting benefits this way shows a finance audience which parts of the case rest on measurement and which rest on modelling, and it directs measurement effort towards the Known tier, where a controlled test is most achievable. Program operators can then build the business case from the Known tier outwards, since a case that leads with estimated value invites challenge on its weakest component.
What do we see when programs measure their own incrementality?
Many brands come to Loyalty & Reward Co to check the health of their program using the Loyalty ROI Optimiser™, a proprietary methodology that quantifies the full commercial return a program generates and identifies where value is created and where it leaks.
Loyalty leaders can usually name the segments they think are responding, the campaigns they suspect are subsidising behaviour that would have happened anyway, and the tier they believe is carrying the program. They are usually right about the direction and wrong about the size, in both directions at once. The same program will be claiming credit it cannot defend in one place while leaving real value uncounted in another.
Three things are usually missing. The business has never agreed how incrementality should be measured, so the method shifts depending on who is presenting and what the number needs to show. The inputs are not agreed either, so active member definitions, redemption rates, and reward costs get pulled from different systems and different reporting periods, and two teams can produce two defensible answers from the same program. And the measurement happens when a budget conversation forces it rather than on a set schedule, which means nobody can tell whether the program is improving or the definition changed. A single program-wide figure produced that way also averages very different results together. Liu (2007) found the behavioural effect concentrated among light and moderate buyers, with heavy buyers changing comparatively little, which is exactly the split an average conceals.
Measure the true return your loyalty program generates
Loyalty & Reward Co use the Loyalty ROI Optimiser™ to build a documented baseline ROI model, size the drivers of program return, identify where performance headroom sits, and benchmark results against industry averages drawn from more than 160 loyalty projects across 13 years. The model is built on the data a program already holds, with every assumption documented so a finance team can audit it.
There is nothing more satisfying than watching a loyalty team see the true return of their program for the first time, with a number they can take into any room in the business and defend.
Contact Loyalty & Reward Co to discuss what your loyalty program is commercially worth.
For related reading, the five categories of commercial value a loyalty program generates set the scope of what to measure, and incrementality addresses the first of them. Once the numbers exist, presenting loyalty ROI to a finance team covers how to structure the case. The academic evidence on whether programs change behaviour is collected in the review of scientific evidence.
Referencias
- Leenheer, J., van Heerde, H. J., Bijmolt, T. H. A., and Smidts, A. (2007). Do loyalty programs really enhance behavioral loyalty? An empirical analysis accounting for self-selecting members. International Journal of Research in Marketing, 24(1), pp31 to 47. https://doi.org/10.1016/j.ijresmar.2006.10.005
- Liu, Y. (2007). The long-term impact of loyalty programs on consumer purchase behavior and loyalty. Journal of Marketing, 71(4), pp19 to 35. https://doi.org/10.1509/jmkg.71.4.19
- Shelper, P. Loyalty Programs: The Complete Guide, Loyalty & Reward Co.