A business that spends €110 to acquire a customer worth €100 destroys value on every customer acquisition, but few marketing and loyalty teams calculate Customer Lifetime Value (CLV) precisely enough (or at all) to know when this occurs.
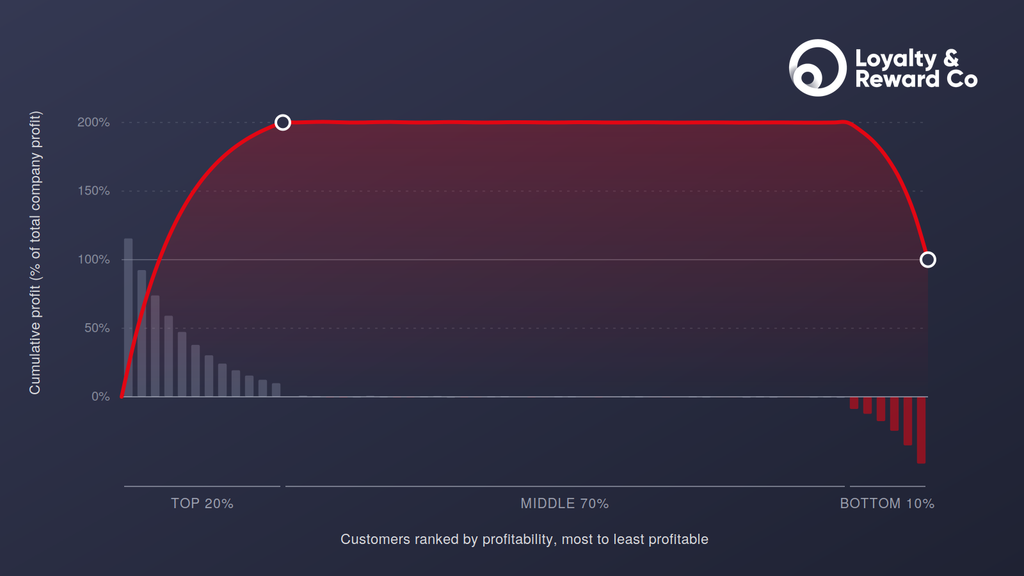
Different departments in the same business often quote different CLV figures for the same customer base because they have arrived at different definitions. Our new book, Loyalty Programs: The Complete Guide (3rd edition) features activity-based costing studies pioneered at Harvard Business School that found the top 20% of customers by profitability typically deliver 150% to 300% of a company’s total profit (yes, over 100%). The middle 70% roughly break even, and the least profitable customers erode it, a pattern known as the whale curve (Kaplan and Narayanan, 2001).
This article sets out what CLV actually measures, the drivers underneath it, how it should shape differentiated investment across a customer base, and how the concept extends into corporate valuation itself.
What CLV actually measures
Customer lifetime value (CLV) is the total value a customer generates for a business over the course of their relationship with it. That definition sounds simple, but two of its terms vary widely.
- Value can mean revenue, margin, or net present value.
- Relationship can mean the period from first purchase or engagement to last, calculated over a short or a long time horizon.
CLV can also be calculated retrospectively, from a customer’s actual historical spend, or prospectively, using a predictive model of expected future revenue over a defined horizon. The two approaches can produce materially different numbers for the same customer, and both are most useful when expressed net of the cost to serve that customer, including reward fulfilment cost.
Program operators need to settle value, relationship horizon, and calculation direction before a CLV figure becomes meaningful.
The CLV calculation
The calculation itself also ranges from simple to sophisticated.
Simple: order value x purchase frequency x customer lifespan
This ignores costs entirely, which matters because revenue is not the same as profit. A customer who spends €5,000 a year is not necessarily more valuable than one who spends €2,000. The higher spender may buy discounted lines, return goods frequently, and consume disproportionate service resources, while the lower spender may buy full-margin products at minimal cost to serve. A profit-first view brings three more elements into the calculation. Margin, meaning the gross profit on what the customer buys; cost to serve, meaning fulfilment, service interactions, and returns; and behaviour cost, meaning the rewards and benefits provided to stimulate spend and retention.
Loyalty programs are one of the few instruments a business has that can capture all three at the individual member level, which is part of why they suit differentiated investment so well.
Margin-adjusted: order value x purchase frequency x gross margin x customer lifespan
Rigorous: discount each period’s customer profit by a discount rate (e.g., interest rates) across the full relationship. This accounts for the time value of money but requires data and modelling sophistication that many businesses do not have.
There is no single correct method. The right level of sophistication is the one a business can actually support with its data.
The drivers underneath the number
The four drivers underneath any CLV calculation are levers a business can pull:
- Average order value (AOV): how much a customer spends per transaction, driving revenue.
- Frequency: how often a customer transacts, also driving revenue.
- Margin: what the business keeps after costs, driving profit.
- Customer lifespan: how long a customer keeps transacting before churning, driving how long the relationship lasts.
Wharton professor Peter Fader has built his research career on a related point: not all customers are created equal, and businesses that treat their base as homogeneous misallocate resources toward customers who do not warrant the investment (Fader and Toms, 2019). CLV is the tool that makes this customer heterogeneity visible across the four drivers above.
The commercial case for CLV
CLV earns its place in a board conversation for four reasons.
It anchors the cost of customer acquisition by setting a ceiling on what a business should pay to acquire a customer. If a customer’s CLV is €100, the acquisition cost should not run to €110.
It justifies retention investment by making a normally invisible effect visible to finance teams, who otherwise see retention spend as a cost rather than return-generating.
It segments customers by true economic worth, quantifying the value gap between segments so that differentiated treatment, better service, better rewards, or earlier access to new products, rests on commercial grounds instead of guesswork.
It aligns the organisation to long-term value. Without a shared CLV definition, different functions optimise for different outcomes. For example, marketing for conversion, service for ticket closure, product for feature adoption, and so on. None of these proxies necessarily point toward the same outcome, but a shared CLV metric does.
Four limitations to CLV
CLV is not a clean number.
- Predictive inaccuracy. Predictive CLV models can be badly wrong during macro shocks or for new cohorts with limited purchase history, since both situations remove the historical pattern the model depends on.
- Averaging the base. A single average CLV figure across an entire customer base is close to meaningless given how skewed most customer bases are.
- Referral value needs deliberate inclusion. Standard CLV formulas measure a customer’s own transactions and can miss the additional customers a referring customer brings in. Capturing it requires a tracked referral program and a CLV calculation adapted to include referred revenue.
- Time horizon variation. There is no universally correct time horizon for the lifespan component, although ‘life’ is in the name. It should be calibrated to the typical relationship length in the category.
Contractual versus non-contractual relationships
The reason CLV modelling sophistication varies so much by sector comes down to one distinction: whether the business relationship is contractual or non-contractual.
In a contractual relationship, such as a subscription or membership, churn is an observed event. The customer cancels, and the business knows the relationship has ended on a specific date.
In a non-contractual relationship, which covers most retail, hospitality, and loyalty program contexts, a customer’s disengagement is not announced. A customer who has not purchased in eight months may be gone for good or may simply be between purchases. A business operating in a non-contractual category should expect its CLV modelling to need more statistical sophistication than a subscription business modelling the same metric.
Conclusion
A business that cannot state, in one sentence, which CLV method it uses, over what time horizon, and against what discount rate, does not have a defensible or pragmatic CLV figure it can safely act on. Before using CLV to set acquisition budgets, justify retention spend, or segment a customer base for differentiated treatment, settle the definition and measurement first.
Sources
Fader, P. & Toms, S., (2019). The Customer Centricity Playbook, Wharton School Press.
Kaplan, R. S. & Narayanan, V. G., (2001). “Measuring and Managing Customer Profitability”, Journal of Cost Management, Vol. 15, No. 5, pp. 5-15.
Shelper, P., (2026). Loyalty Programs: The Complete Guide, 3rd edition, Loyalty & Reward Co Pty Ltd.