
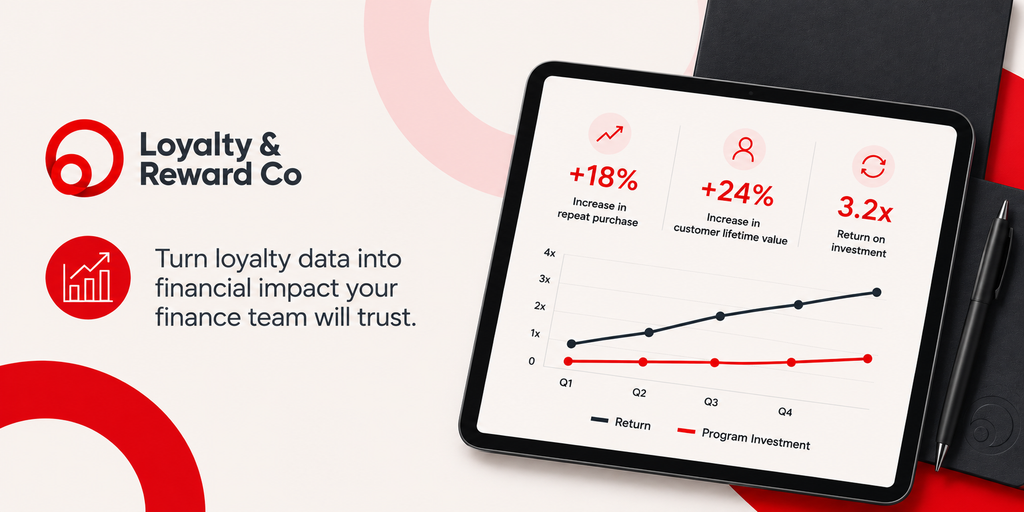
Many loyalty programs deliver genuine commercial value. The teams running them know it, the members feel it, and the data very often confirms it. Yet at budget time, loyalty leaders often find themselves defending the program against a finance department that remains unconvinced.
The problem is rarely the performance, but in the way program value is presented.
Why Do Loyalty Business Cases Fail in the Boardroom?
Most loyalty business cases are built on one category of value, when the program is generating value across five.
Loyalty & Reward Co Senior Commercial Analyst Anand Patel sets out those five categories in Five Ways Loyalty Programs Generate Commercial Value, which are:
- Behavioural changes
- Cost savings and operating efficiencies
- Strategic decision-making benefits
- Third party commercialisation
- Other monetisation opportunitie
Behavioural change is the category loyalty teams reach for first, because it is the one program mechanics directly control. It is also, (on its own) the weakest case to put in front of finance because it is the category where attribution is most contested. The accounting treatment compounds the problem. Reward costs, platform fees, and campaign spend land in the marketing budget as visible outflows, while the returns are diffuse, delayed, and difficult to attribute to the program alone. A program assessed only on its cost line invites cost reduction, which usually means devaluing the reward and weakening the behaviour the program exists to stimulate.
The finance department reviewing a loyalty program generally considers three questions:
- Does this program generate more value than it costs?
- What would the business look like without it?
- Is this the best available use capital?
A presentation that addresses only the first question, and only through behavioural data, will struggle for approval regardless of how well the program is performing.
How Should Behavioural Value Be Translated for Finance?
Behavioural value is real, and it belongs at the front of the business case. It needs restating in the measures finance uses to evaluate every other line of investment.
Member count carries little weight on its own. The figure finance wants is the incremental revenue those members generate above what they would have spent without the program. That requires a controlled comparison, either between members and a matched cohort of non members, or between pre-enrolment and post-enrolment spend for the same customers.
Engagement rate translates to average spend lift per member, and the depth of engagement matters more than membership itself. McKinsey found that an active member spends around 10% more than a member who is enrolled but inactive, while members who redeem spend around 25% more than the enrolled and inactive group. Redemption is the behaviour that compounds, which is a useful corrective for programs that quietly optimise for low redemption rates.
Redemption rate is often presented as evidence of program health. The financial translation is customer retention cost (CRC) measured against cost per acquisition (CPA). The discipline here, as Patel notes, is to count only the incremental cost of retaining a member, such as an incentive conferred specifically to secure renewal, rather than loading all ‘cost to serve’ into the calculation. Without that discipline, retention looks more expensive than acquisition and the business invests in the wrong direction.
Customer lifetime value is a measure finance already understands. Presenting the CLV delta between active members and non members, over a consistent time horizon, states the program’s contribution in terms that compare directly against other investments.
Which Cost Savings Belong in the Business Case?
Value generated on the cost side is easier to defend than revenue uplift, because it sits closer to observable spend. Finance teams tend to accept it with less argument, which makes it valuable early in a presentation.
Three areas account for most of it. A program establishes a direct marketing channel to identified customers, which reduces reliance on paid media and improves return on advertising spend, a point that carries more weight as walled garden platforms grow more expensive. Conferring a loyalty currency protects headline pricing in a way discounting does not, which shows up as margin retention. Program data feeds demand forecasting, which can reduce holding and shipping costs.
The trade-off deserves naming in the presentation. Efficient rewards protect margin, though a currency members perceive as poor value will not stimulate behaviour, and the cost saving is then illusory. Raising that tension before finance does signals that the loyalty team understands the commercial picture rather than selling into it.
How Is Data and Decision-Making Value Quantified?
This is the category most often left out of the business case entirely, and the hardest to attribute.
Program data informs location and network decisions, customer value proposition evolution, brand positioning, and value chain extensions. Attributing a dollar figure to better decisions is more difficult than attributing incremental spend. Operators who attempt it usually isolate a specific decision the data enabled, then model the outcome against the counterfactual.
One example carries a useful caution. Patel describes a major telecommunications operator that used churn scoring to target at-risk customers with free handsets, bonus points, and waived fees, an approach viewed internally as paradoxically anti-loyalty, because genuinely loyal customers scored low and therefore received little. Presenting a single well documented decision, including where the approach created tension, tends to land better with finance than a general claim that the data is valuable.
What About Third Party Revenue?
At sufficient scale, programs shift from supporting the core business to earning revenue in their own right. Delta Airlines reported that remuneration from American Express reached 8.2 billion US dollars in 2025, and expects that figure to grow towards 10 billion US dollars.
Very few programs reach that scale, and a business case that implies otherwise will lose credibility quickly. Proprietary programs have less access to this category than coalition programs, though the opportunities remain open in part. Supplier funded offers are one accessible route. Where a program is early in its life, the honest position is that third party revenue is a future option contingent on member volume, and saying so protects the rest of the case.
How Should the Counterfactual Be Addressed?
The counterfactual is the question that often goes unaddressed, and the one that matters most to finance.
Two approaches work in practice. A member vs non member analysis compares the spend behaviour of enrolled and non-enrolled customers with similar baseline profiles, which suits established programs with sufficient data. A regional or channel test withholds the program in one market while running it normally in another, then compares spend behaviour across the two.
Both have limitations worth acknowledging in the presentation. A member vs non member comparison can overstate program impact if members self select based on existing loyalty rather than program driven behaviour. A controlled test is more rigorous, though it requires operational discipline and a tolerance for short-term disruption in the test market. Presenting the method alongside its limitations builds credibility with finance rather than undermining it.
How Should the Business Case Be Structured?
Lead with the financial summary. State the program’s net return in dollar terms and as a percentage of program investment, for the most recent full year and trending over time. Finance reads executive summaries first, and detail that follows a weak summary tends to go unread.
Follow with the value map across the five categories, quantified where the data supports it and marked as directional where it does not. This is the section that distinguishes a loyalty business case from a marketing budget request, because it shows returns the marketing line never captures.
Address the liability. Loyalty programs carry a points liability on the balance sheet, and CFOs are aware of it. Bringing the breakage rate, the redemption trend, and the controls in place to the table works better than waiting for finance to raise them.
Close with capital allocation context. If the program retains a customer at a lower cost than paid media acquires a new one, state that comparison plainly, since it answers the third question directly.
Frequently Asked Questions
What metrics does a CFO want to see from a loyalty program?
Incremental revenue attributable to the program, total program cost including points liability, customer retention cost measured against cost per acquisition, and the customer lifetime value delta between members and non-members. Program metrics such as member count and redemption rate support these figures rather than replacing them.
How do you prove a loyalty program drives incremental revenue?
Through a controlled comparison, either between members and a matched non-member cohort, or by withholding the program in one region or channel and comparing spend behaviour. Both methods carry limitations, and stating them alongside the result strengthens the case.
Should points liability be raised in a loyalty business case?
Raising it proactively tends to work better than waiting. Presenting the breakage rate, redemption trend, and controls in place demonstrates that the loyalty team understands the full commercial picture.
Which of the five value categories should a business case lead with?
Behavioural change, since it is the category program mechanics directly control and the one with the clearest measurement path. Cost savings usually make the strongest supporting evidence, because they sit closest to observable spend.
Is your loyalty program delivering ROI your finance team can believe in?
Our loyalty program consulting services help brands assess the commercial impact of their loyalty strategy and build a clear, compelling business case for investment.
From program economics and customer value to incremental revenue, costs, and ROI measurement, our experts help turn loyalty data into the financial story your stakeholders need to see.
Learn more about our loyalty consulting services and contact us today to discuss how we can help you demonstrate the value of loyalty.